One of the most popular subscriber resources in the SellingBrew Playbook is an on-demand training session called Moving the “Meaty Middle”.
In this session, we expose how and why leading Sales Ops groups are focusing their improvement efforts on the 60-70% of the sales team that represents the heart of the performance Bell Curve. We show how moving this larger group of “typical” or “middle of the road” reps can actually provide a lot more leverage on performance than the small number of already-stellar superstars.
And then of course, the bulk of the session is about exploring the top strategies and tactics that have proven to be effective for others in improving the systemic performance of the “Meaty Middle” at scale.
The session was very well-attended when it was first delivered live and it’s been getting constant on-demand replay in the Playbook library ever since. From my perspective, it’s always great to see such strong interest in a topic that while being highly transformative is admittedly more than a little esoteric.
That said, however, some recent questions through the Help Desk have motivated me to reiterate and emphasize just how important it is to leverage comparatives when measuring your progress with the Meaty Middle over time.
Now, using comparative measures is a good idea for any improvement initiative, under any market condition. But I feel the need to underscore just how important comparative measures are when market conditions are ugly. When demand is shaky and the selling environment is hit-and-miss, measuring the Meaty Middle solely against itself can be highly misleading and very frustrating.
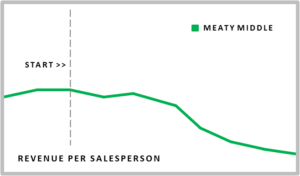
Imagine spending weeks or even months implementing a bunch of systemic improvements designed to boost average performance in the middle 70% of your sales force. Of course, you’re keenly interested in how these changes are working and you want to be able to demonstrate to management that your efforts are worthwhile, so that you can go further and do even more.
But when you look at the trends for your Meaty Middle, it seems as though your interventions have actually been doing more harm than good! Performance over time since you began implementing your so-called improvements has been going down, not up!
So what gives? All of these improvements seemed to be such no-brainers; so how could they have failed so hard? How could you have messed up so spectacularly? How will you deal with the shame you’ve brought upon yourself and your family?
At this point, the issue is likely quite obvious to you, dear reader…
Looking solely at the Meaty Middle over time, there’s just not much context. Sure, we can see how they’re doing now relative to how they were doing before. But that’s only really meaningful if we assume that everything else about the selling environment has been constant over that same time frame. And given the volatility of the markets these days, we all know what a silly assumption that would be, right?
Under difficult market conditions, comparatives provide necessary context and paint a more complete picture of what’s going on, so that we can draw more accurate inferences and conclusions.
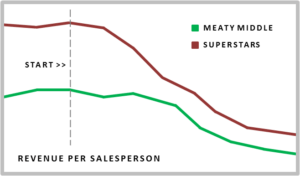
With a comparative in place, we can see that overall market conditions have been such that our Superstars have also been negatively impacted…but to a much greater degree than across our Meaty Middle.
So the implication here is that despite the challenging market conditions, our improvement efforts have indeed helped close the performance gap between our Superstars and the more typical, middle-of-the-road salespeople that comprise the bulk of our sales team. Note that this is the opposite of what we concluded looking at our Meaty Middle trends in isolation.
The point is that it’s just human nature that whenever we’re intensely focused on something, it’s very easy to become myopic about that thing and lose sight of everything else. But when we can get into the habit of always using comparative measures, we can avoid the negative consequences of this type of myopia and save ourselves a lot of frustration.
Moving the "Meaty Middle"
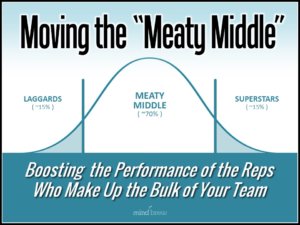
The primary focus for Sales Ops should be on improving the performance of the middle-of-the-road salespeople who comprise the majority of the team. In this on-demand webinar, learn why it's so important and how to make it happen.
Successful Sales Ops Pilot Programs
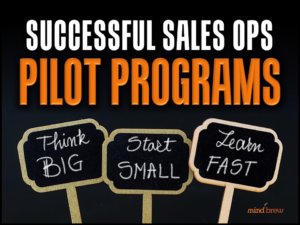
How do you get your company to accept new sales tools and approaches, while maximizing your odd of success? In this session, learn how to leverage pilot programs and in-market trials to accelerate your progress.
More Effective Onboarding
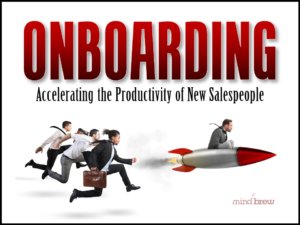
Every sales operation wants to get new reps productive faster. But making that a reality can be a challenge. In this session, we share key insights and principles for making onboarding more efficient and effective.